v2 new feature - IDF
The IDF Curve Fit tool manipulates data describing an
Intensity-Duration-Frequency for a particular geographical locality
and can be used in two modes:
- To compute the ‘a’, ‘b’ and ‘c’ parameters of a Chicago
hyetograph that most closely approximates a set of observed data.
- To compute the IDF curve for user-supplied values of the three
coefficients and compare this with observed data.
The mode is selected by checking the ‘Optimize’ check box on the
form or clearing it to simply compute the curve for specified values
of ‘a’, ‘b’ and ‘c’.
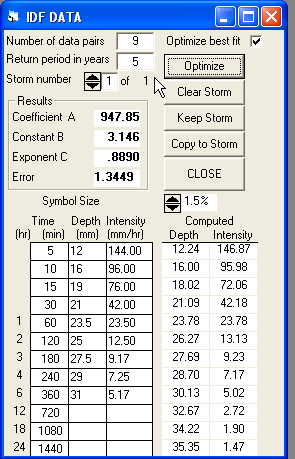
The figure above shows data that has been entered for the first mode
of operation.
In the grid on the left for Time, Depth and Intensity a column of time
intervals is displayed as shown. These values can be customized if
desired.
For any time interval the rainfall can be defined either as a total
depth of rainfall or as an average intensity over the time interval.
Entering either value automatically displays the other. The number of
data pairs is automatically displayed in the top of the form and not
every time interval need be entered.
When the [Optimize] button is clicked several things are displayed:
- The optimal values of the three parameters
- The computed values of Depth and Intensity for each time
interval. These are shown in the right hand grid.
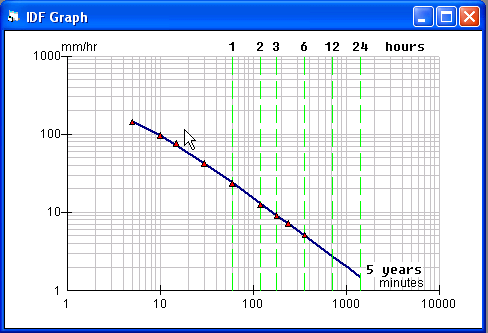
- A ‘log-log’ graph of both observed and computed values is
displayed.
A typical result is shown below
Data for different return periods (E.G. 5, 10 & 50 years) can be
processed and the IDF graphs are accumulated on a single graph.
By clearing the ‘Optimize best fit’ box the top command button is
re-labelled [Calculate]. You can then enter values of ‘a’, ‘b’ and ‘c’
that differ from the optimized values previously calculated.
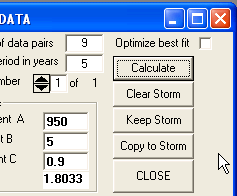
Clicking [Calculate] causes the computed values of depth and
intensity to be revised and the blue curve on the graph is re-plotted.
Typically the error reported between observed and computed values of
rainfall will be increased. This lets you experiment with
parameter values for practical use.
|